Eleanor of England, Queen of Castile, and her daughter Berengaria, were both powerful Queens in Castile in medieval times.

Eleanor (1161 – 1214) was the daughter of Eleanor of Aquitaine and Henry II of England (which means she was also the sister of Richard the Lionheart and King John of England). At the age of 12, she married King Alfonso VIII of Castile, in Burgos. It seems that the dynastic reason for the marriage was to shore up the borders of Aquitaine, which bordered Castile (including the somewhat disputed territories of Gascony and Navarre – the French and Spanish Basque country in modern times). So far, doesn’t sound especially powerful. But, possibly because Spain gave women more influence than in most countries in Europe at the time, in her marriage treaty, she was given direct control of many lands, towns and castles throughout the kingdom, which made her almost as powerful as her husband the King.
Eleanor had 12 documented children over 24 years – seven daughters and five sons. The daughters, between them, ended up as Queens of Castile, Portugal, France, and Aragon, with those weddings taking place during Eleanor’s lifetime (and probably arranged by her). It is her oldest child, Berengaria, Queen of Castile, who wielded the most power, as well as adding to the dynastic power by managing her own children’s marriages carefully. Eleanor’s sons didn’t manage to make nearly as big a mark on the world, with most of them dying in infancy. Ferdinand lived to 21, only to be killed by a fever, and Henry, the youngest, inherited the Kingdom at the age of 10, only to be killed by a falling tile three years later.
Berengaria (1179 – 1246), Eleanor’s oldest child, was, given her parentage, of considerable interest on the Europe wide marriage market, and as part of her first betrothal to a younger son of the Holy Roman Emperor, at the age of 10, the proposed marriage treaty documented that she would inherit the throne of Castile after her father and any of her brothers who died without issue. That treaty, even though the marriage never got beyond a betrothal, helped her considerably later in pressing her claims to the throne when her father and younger brother died in reasonable quick succession.
She eventually (1197) married King Alfonso IX of Leon, the neighbouring Kingdom to Castile, who was her first cousin once removed. That close relationship was too much for the Catholic Church, and eventually after a lot of argument the Pope annulled the marriage in 1204, although their four surviving children stayed legitimate.
After acting as regent for her younger brother Henry for a number of years after her parents died in 1214, when he died in 1217, she became Queen in her own right. Although she decided to abdicate in favour of her son Ferdinand fairly quickly, to avoid too much argument about the succession. However she continued to exercise most of the power in the country, as regent for Ferdinand.
Like her mother, she had considerable property in her own right, as part of her inheritance from her parents, and as part of the marriage settlement with the King of Leon. When her ex husband Alfonso (and father of her son Ferdinand, King of Castile) died, she managed to negotiate a union of the two kingdoms, so that Ferdinand would inherit both. She then went on to rule as regent frequently throughout Ferdinand’s reign, whenever he was away south battling Al-Andalus (most notably retaking Cordoba).

Berengaria died in 1246, at the age of 66, after a long life exercising considerable power in Northern Spain. In addition to her son Ferdinand, now King of a much enlarged Castile and Leon, one of her daughters became empress consort of Constantinople, her son Alfonso was a key general in the conquests of Cordoba and Seville.
Eleanor and Berengaria were worthy heirs of their mother and grandmother Eleanor of Aquitaine, taking and wielding power as much or even more than was normally done by royal women in the 12th and 13th centuries. Although when you go looking for them, there are more powerful women in those times than it seems at first glance – I would never have noticed these two in the history of Spain if it wasn’t for a fascinating tour of the Monastery of Santa Maria le Real de las Huelgas in Burgos, northern Spain, where they are both buried.
![IMG_1242[1]](https://penguinunearthed.files.wordpress.com/2019/03/img_12421-e1553317059263.jpg?w=187)
 You can tell just by looking at the framing that this local member comes from the conservative side of politics (“securing Australia’s borders”). But it is actually a useful thought starter. If you can only pick four, what are your top four issues? And what do you want done about them? I’m a big fan of forced prioritisation. So I gave it a go. This list is for the Federal (Australian) election. Despite the state election being first, I haven’t figured out my priorities there, although they aren’t actually all that different.

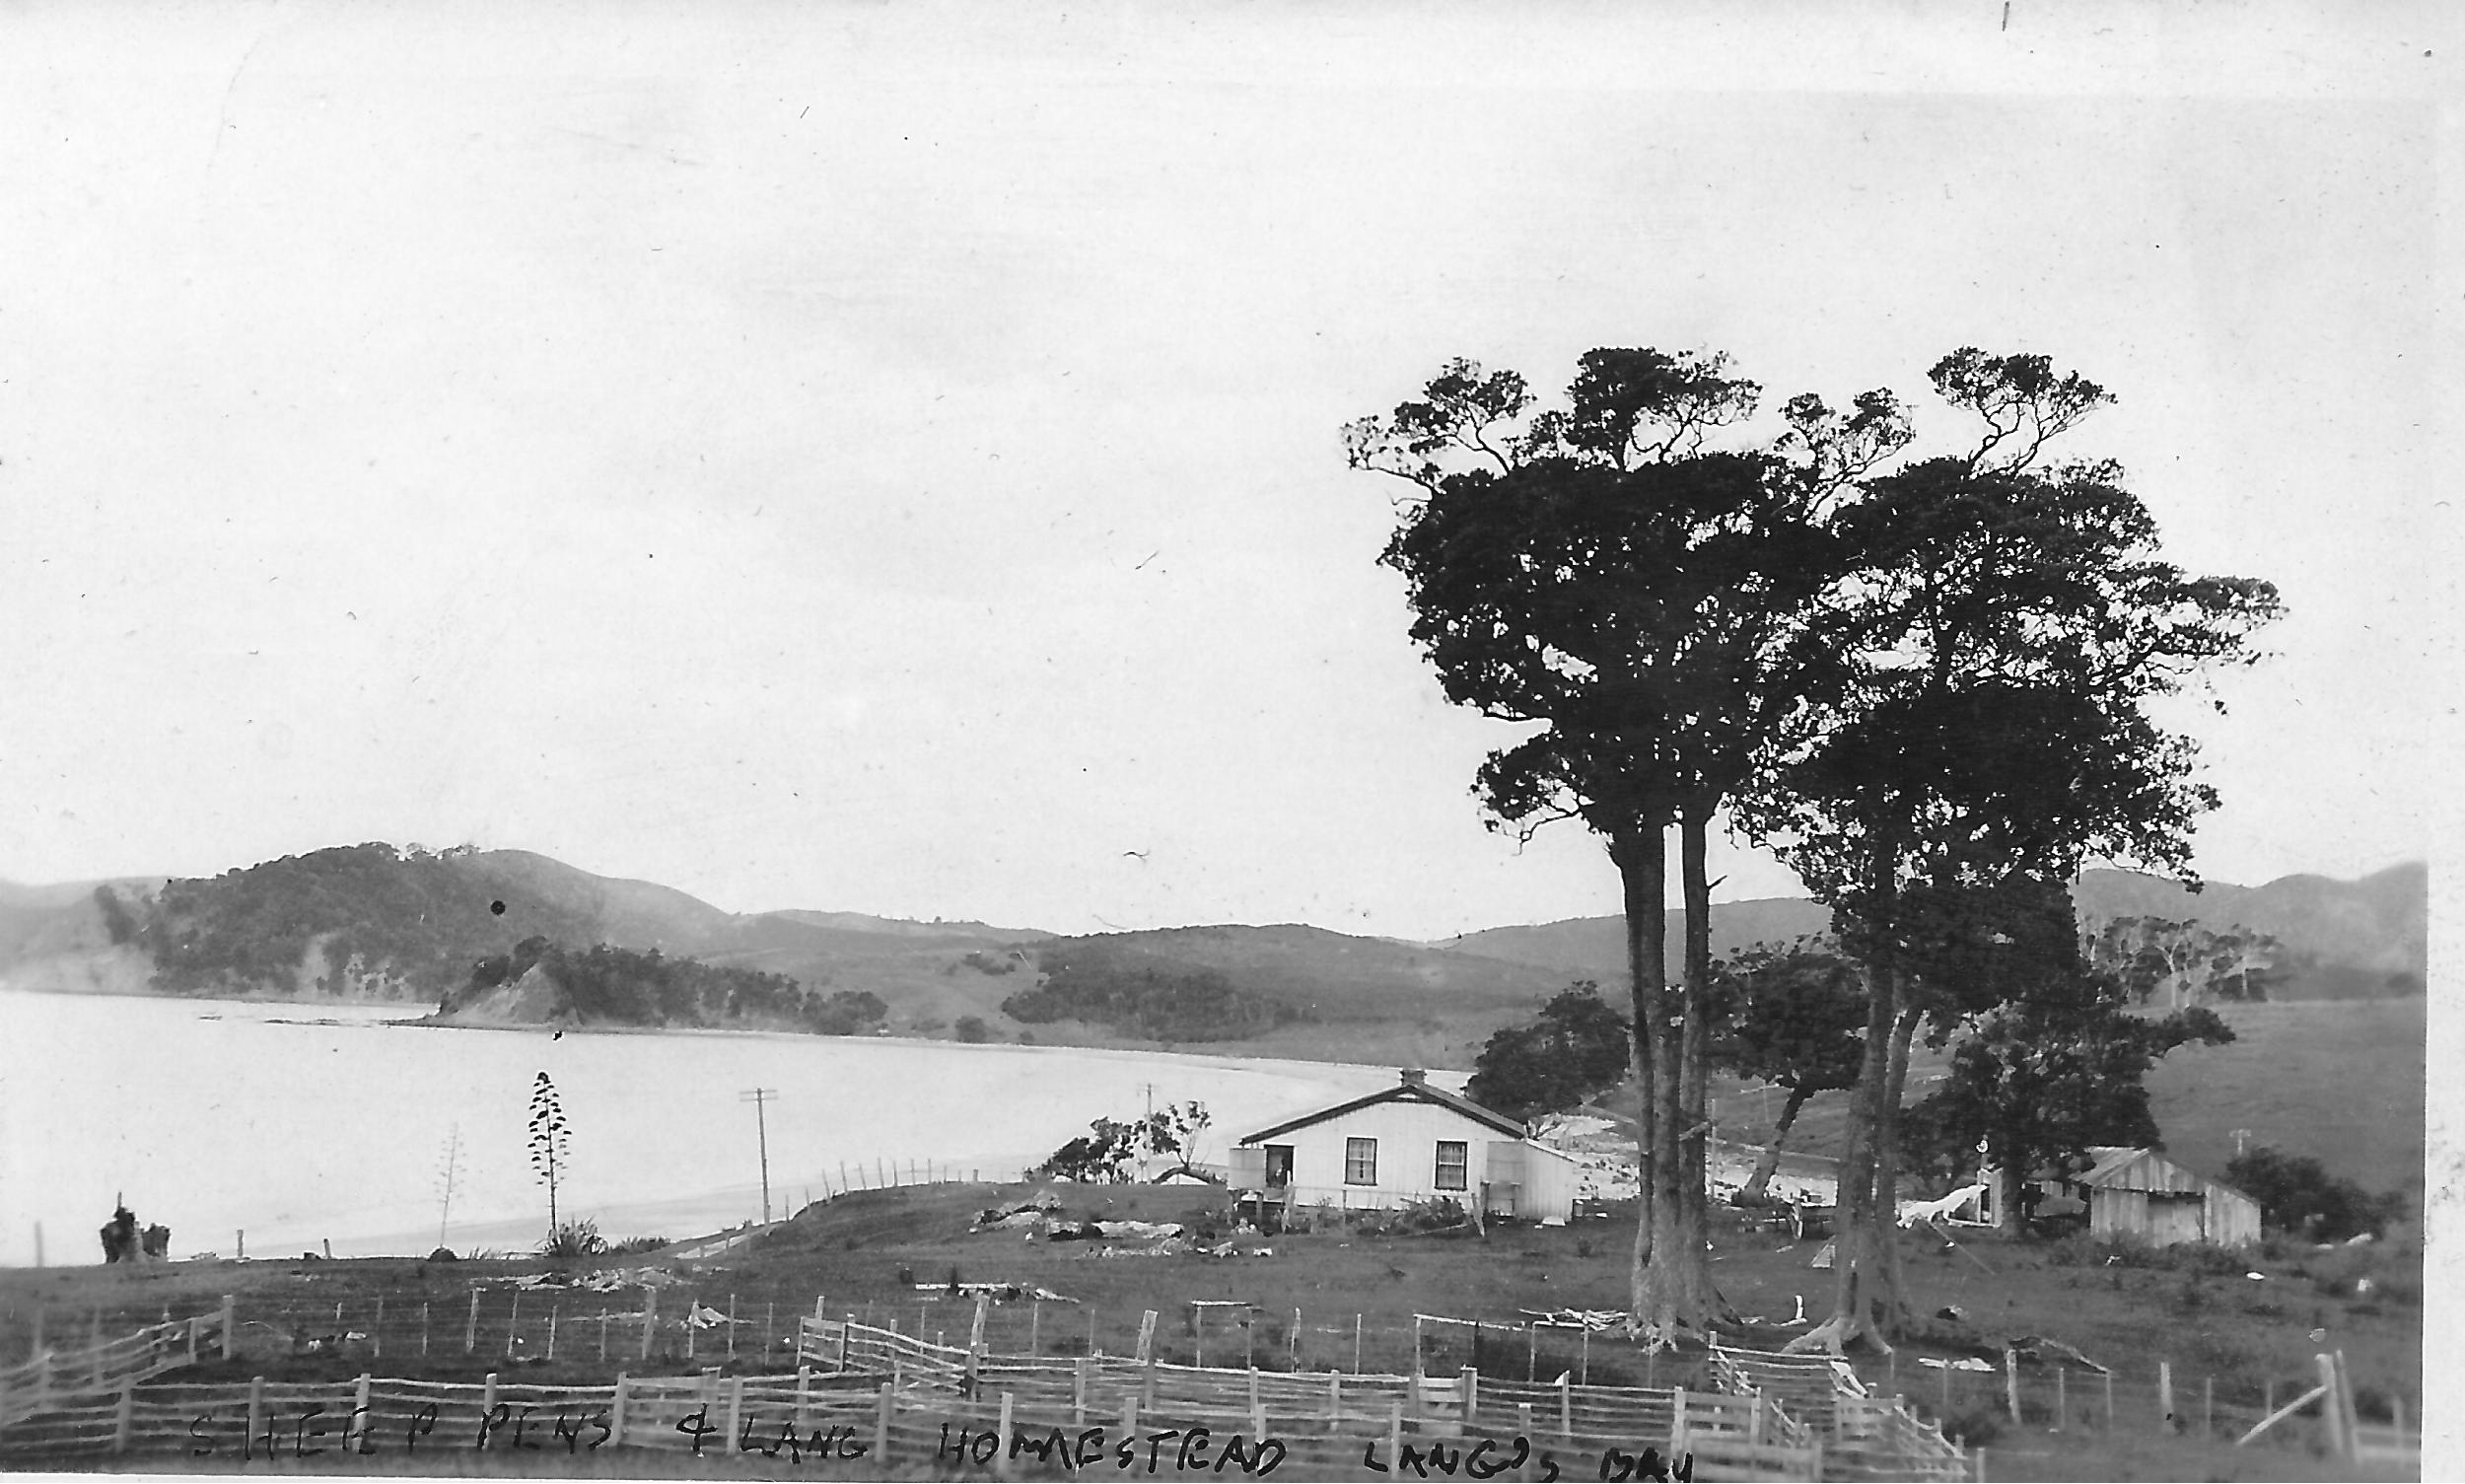 When I first met the Aunts 50 years later, they lived in what was affectionately known (by us at least) as The Auntheap, not quite the original family house in Langs beach, pictured here around 1925.
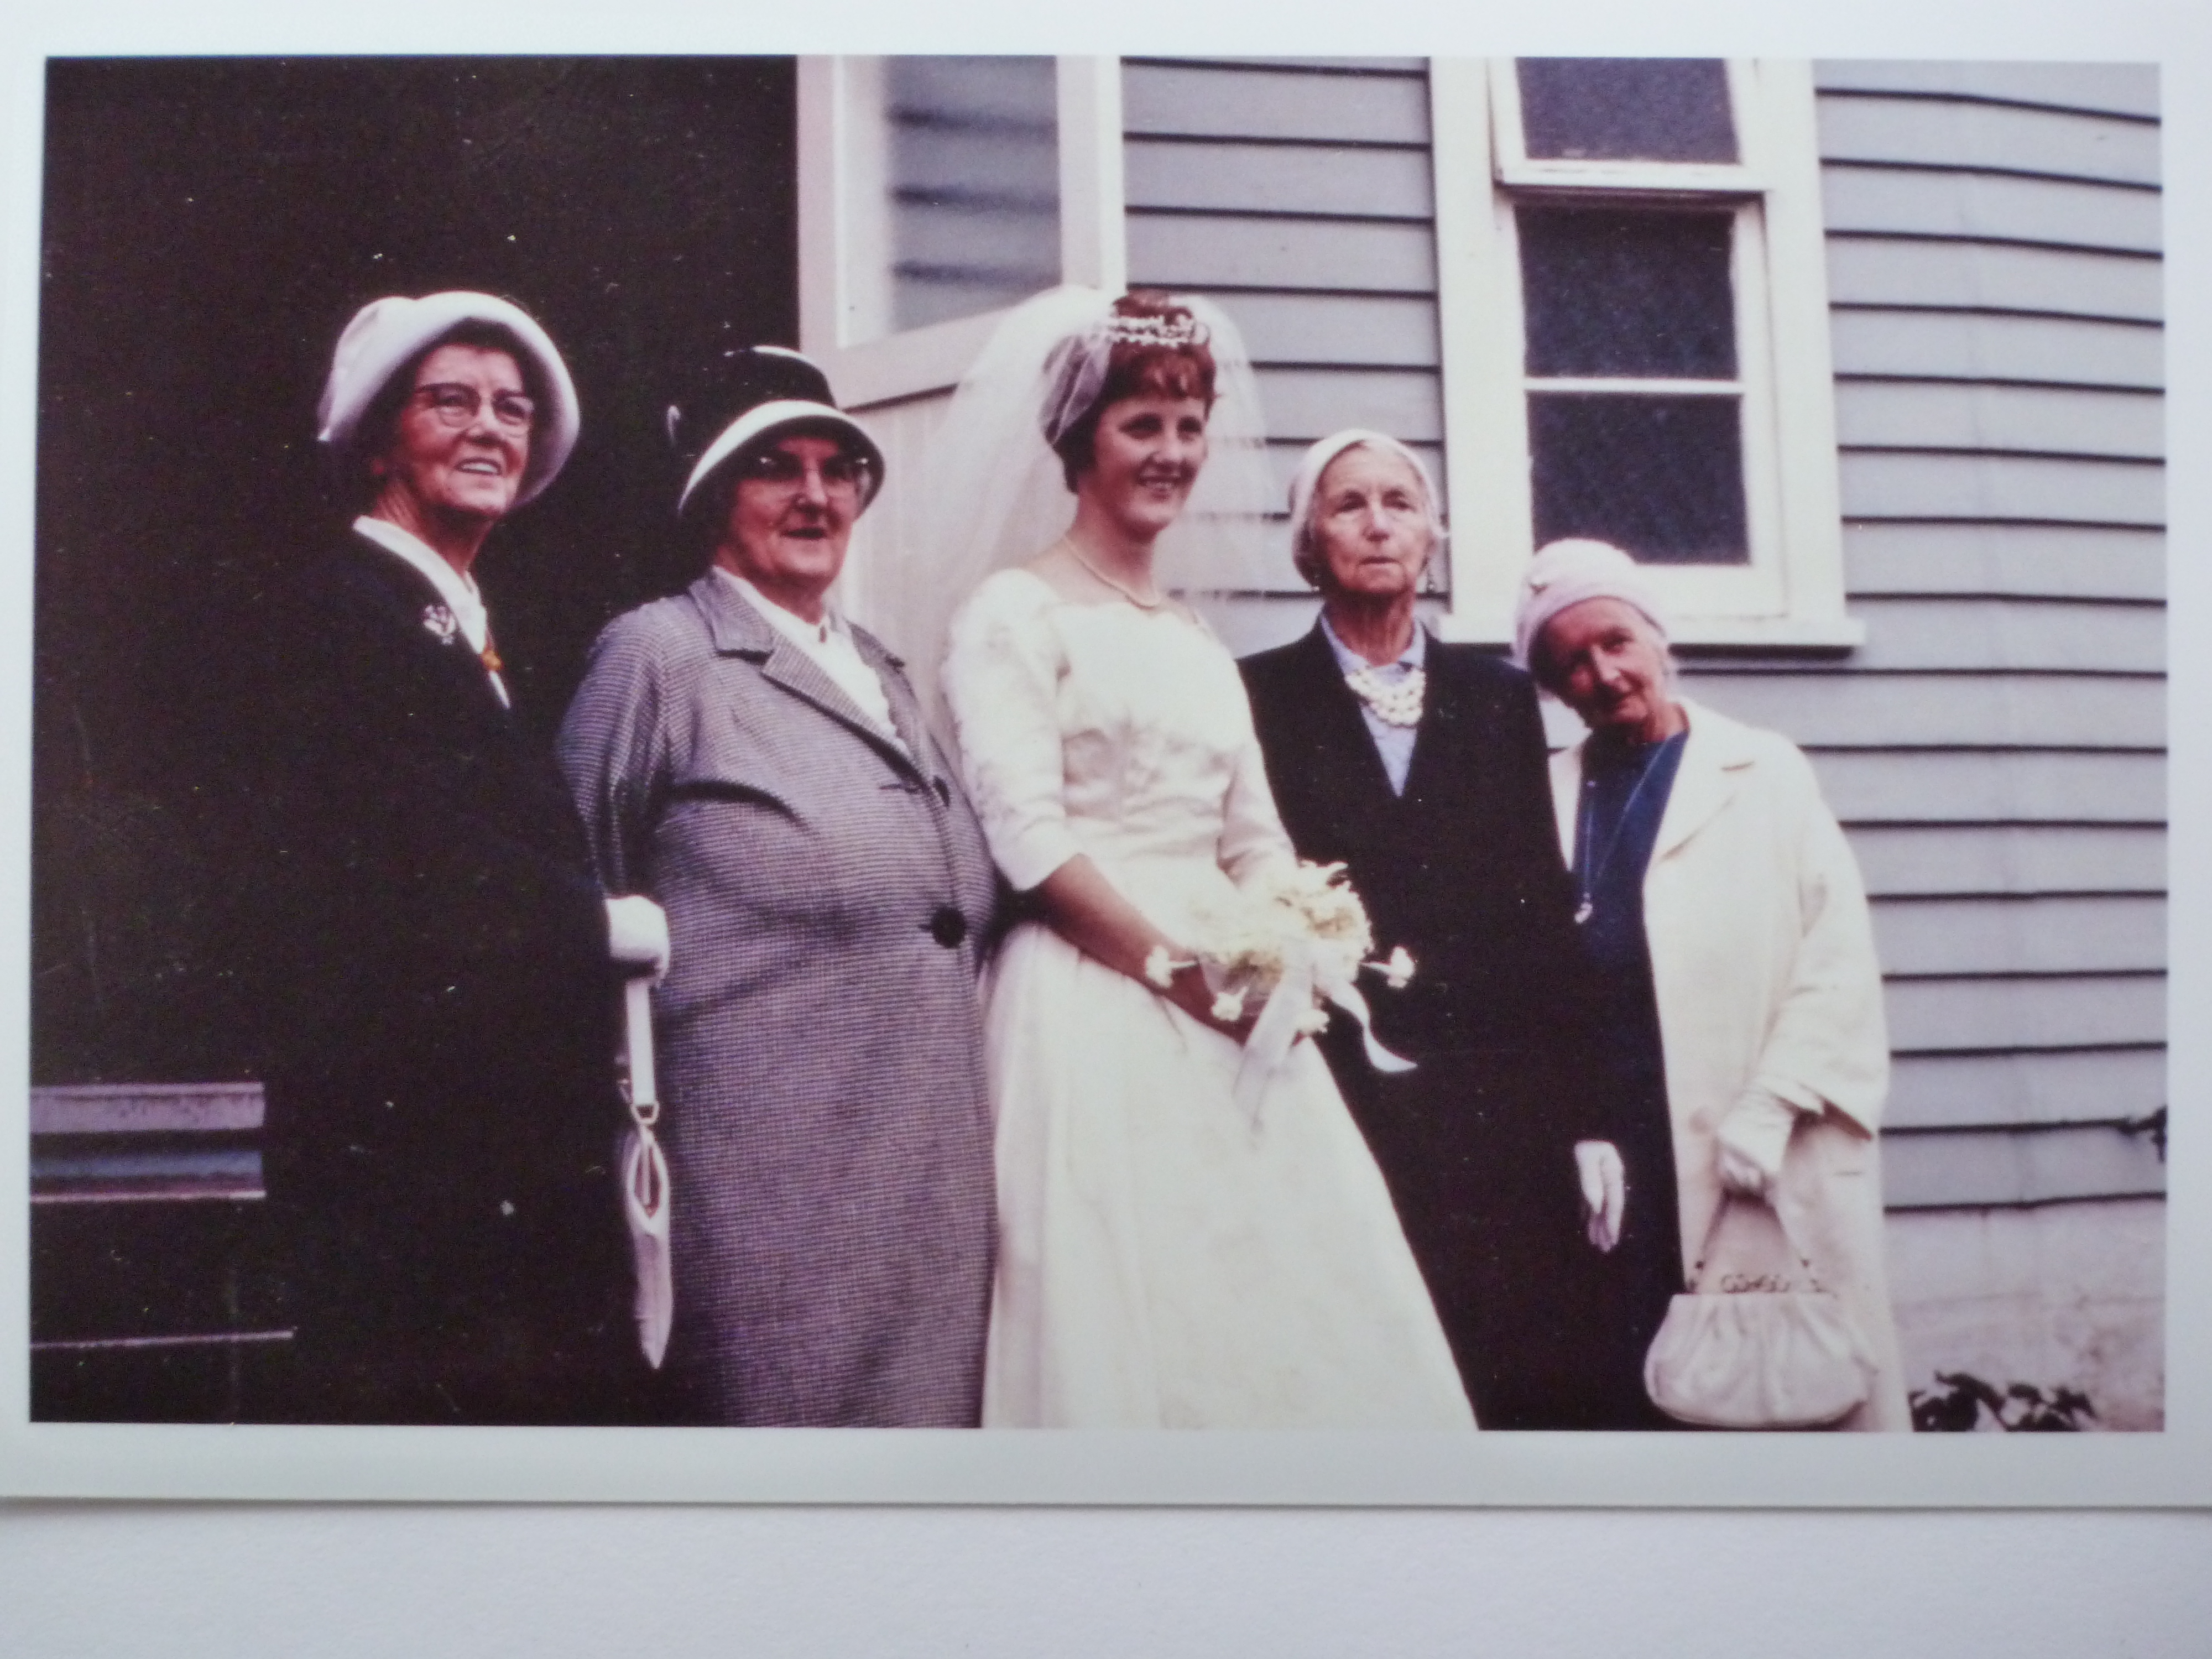


